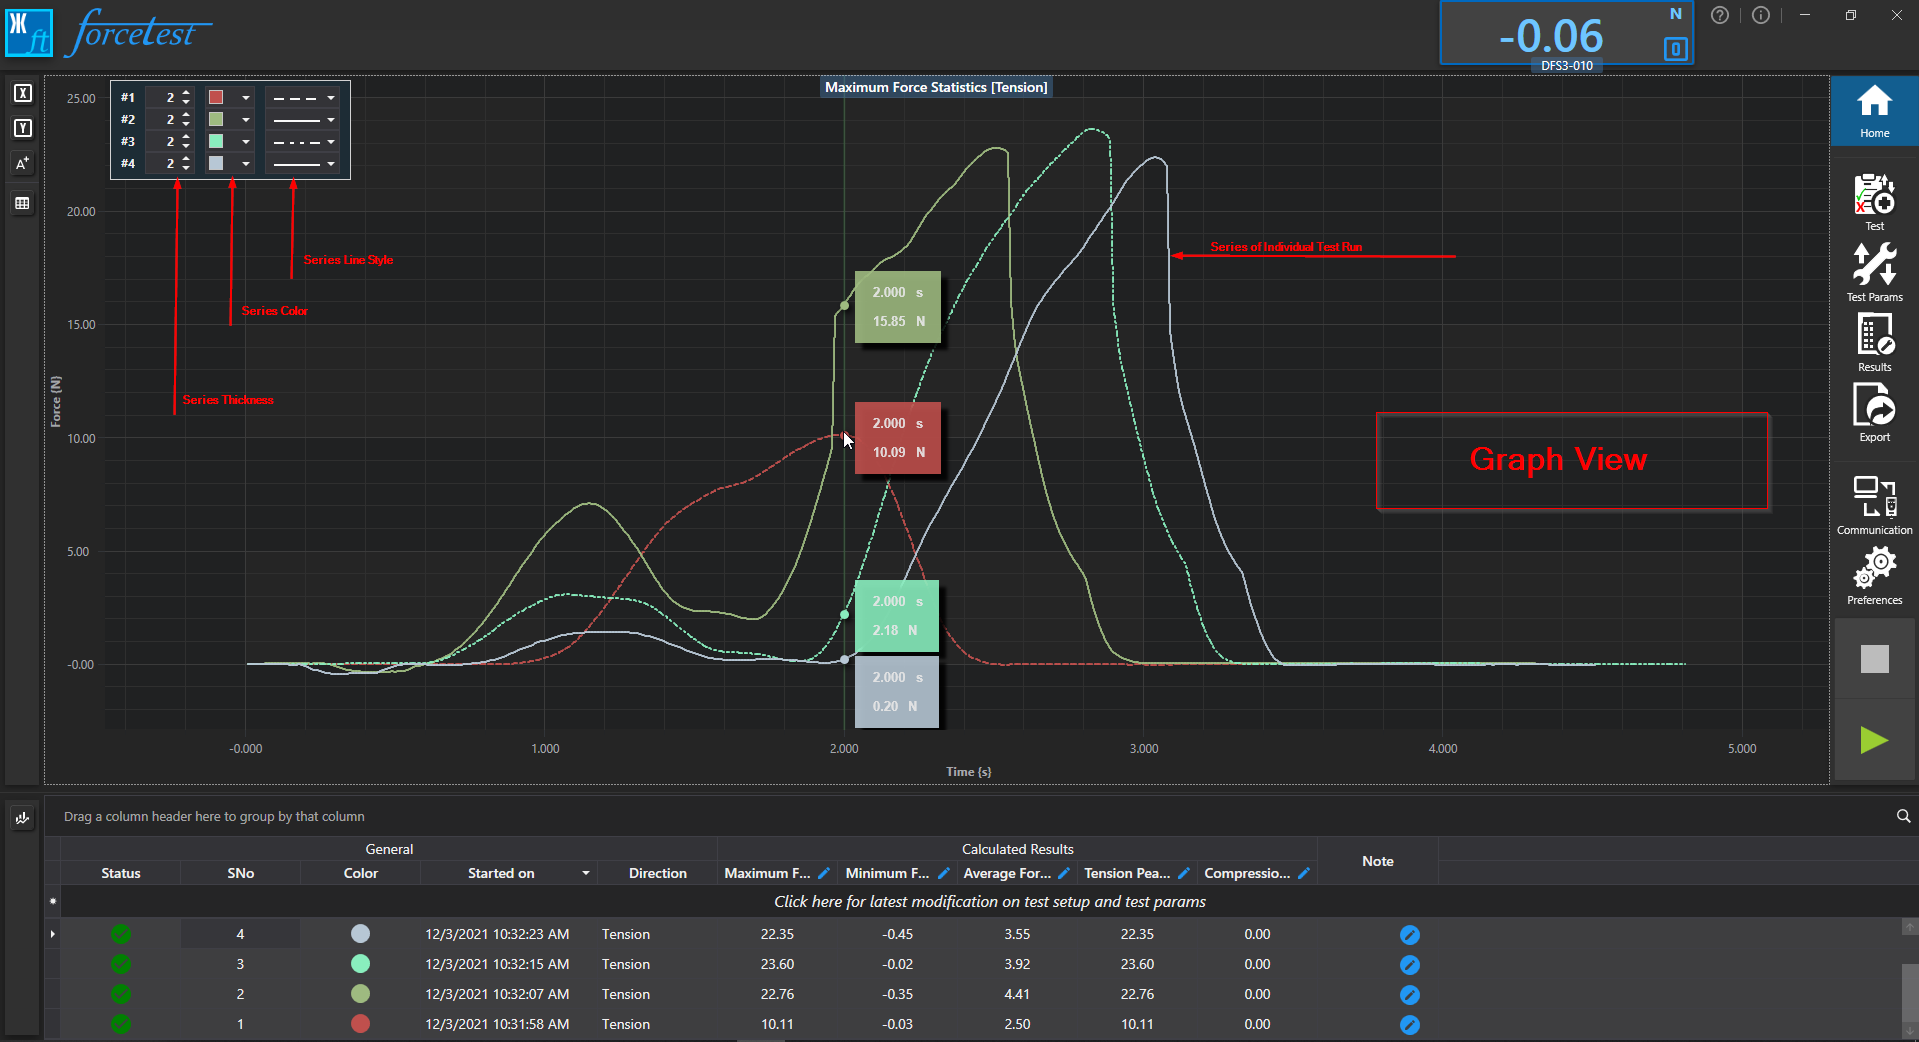
Graph View
This section describes the Graph View and it's configuration.

Features provided by GraphView:
- Display of Line Series for selected Test Records or Test Runs. You can select multiple test record from Test Record View.
- You can add/remove multiple annoations Annotation.
- Series thickness, color and line style can be changed using the controls placed at top-left of the Graph View.
- X and Y axis can be customized from Axis Settings.
- You can Zoom the graph using Ctrl + Mouse Wheel. You can reset the zoom by double clicking on Graph View.
- Axis Panning can be done by dragging the X or Y Axis.