Axis Setting
This section describe the settings provided to customize X and Y Axis of Graph View.
Click X or Y button in left tool panel to access X-Axis and Y Axis respectively.
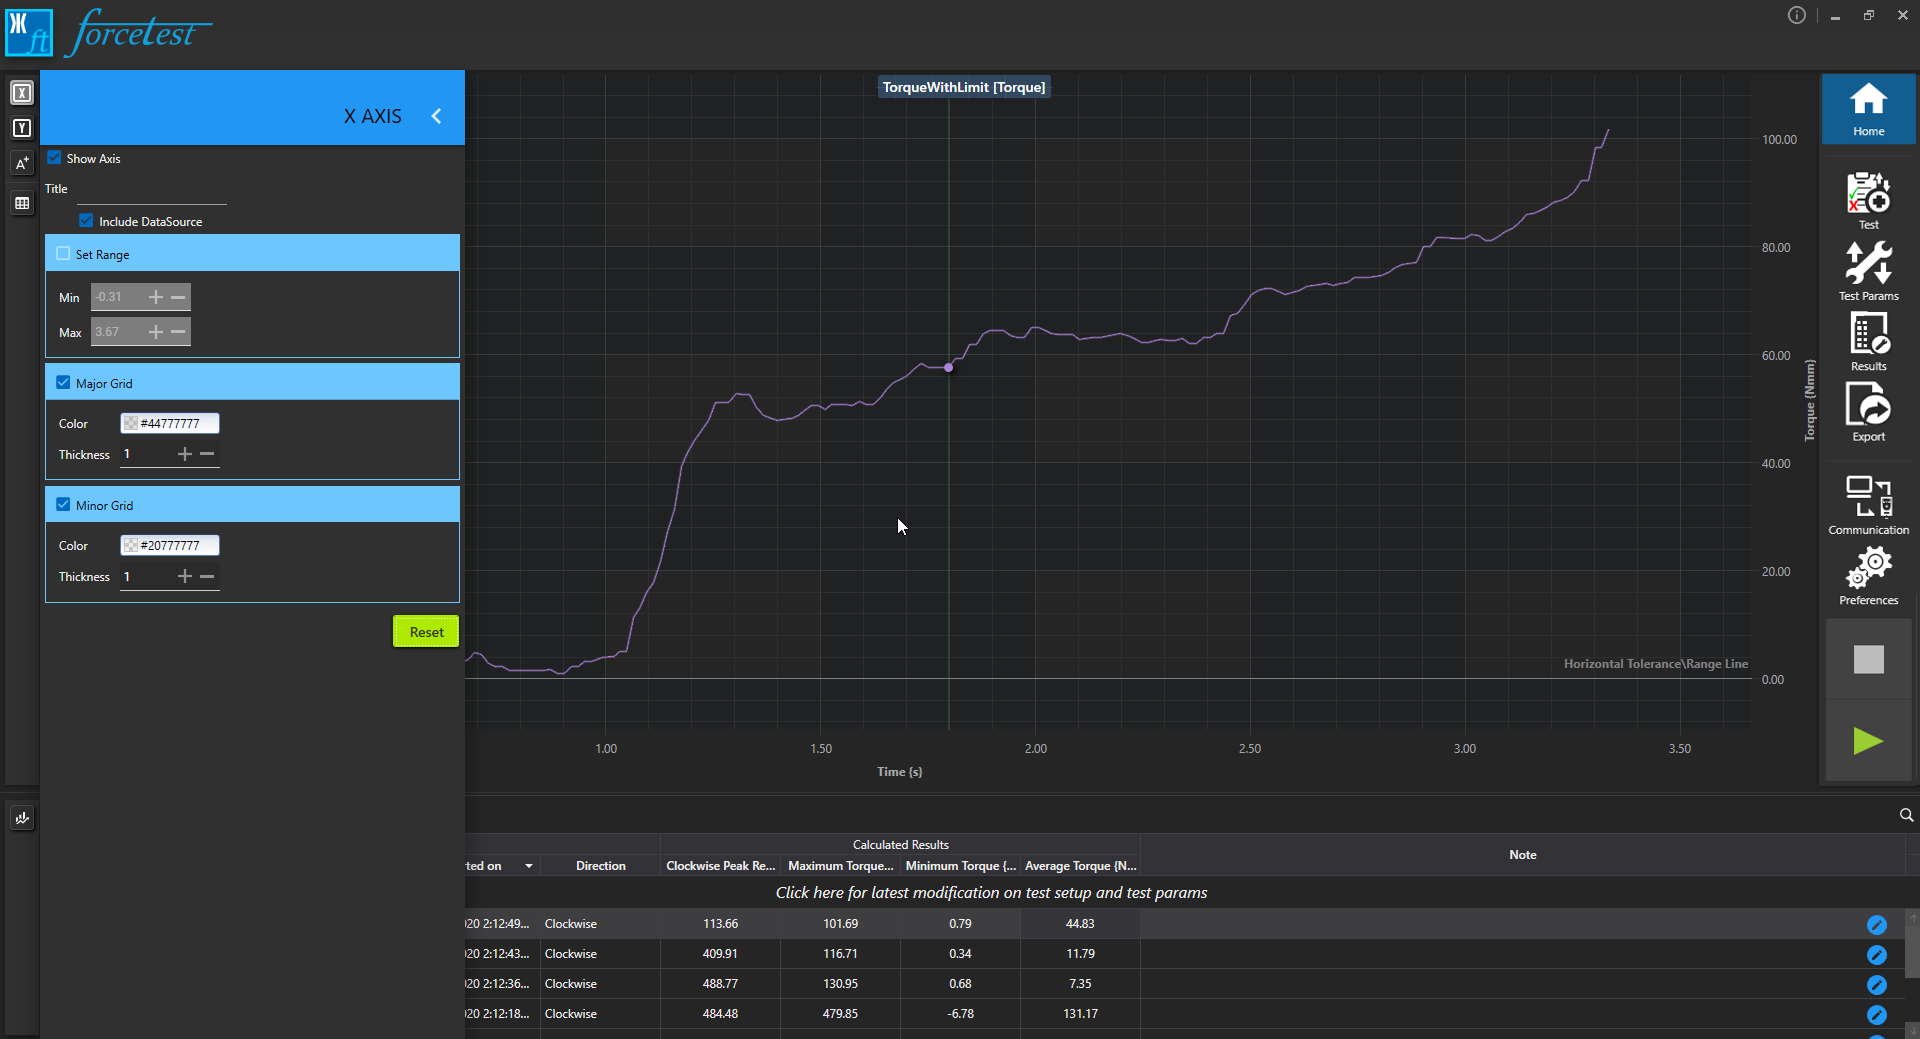
- Show Visible will show/hide the respective axis.
- Title will change the Axis name. Enabling Include DataSource will add the data source name of the reading of that axis.
- Set Range will allow you to set the axis range. By default it will be auto range in which Graph View adjust automatically along with the plotted series.
- Major Grid enables you to set the color and thickness of the major grid lines which appears at every displayed axis value(s).
- Minor Grid enables you to set the color and thickness of the minor grid lines.
Reset will reset all the settings to factory defaults.