Results
This section describes the test results and it's configurations.
The test and supported results are listed below:
| Result \ Test | Tension | Compression | Peel | Friction | Torque |
|---|---|---|---|---|---|
| Maximum Force | ✓ | ✓ | |||
| Minimum Force | ✓ | ✓ | |||
| Average Force | ✓ | ✓ | |||
| Break Force | ✓ | ✓ | ✓ | ✓ | |
| Fracture Force | ✓ | ✓ | ✓ | ✓ | |
| Elapsed Time | ✓ | ✓ | ✓ | ✓ | ✓ |
| Tension Peak Register | ✓ | ✓ | ✓ | ✓ | |
| Compression Peak Register | ✓ | ✓ | ✓ | ✓ | |
| Static Load | ✓ | ||||
| Kinetic Load | ✓ | ||||
| Coefficient of Static Friction | ✓ | ||||
| Coefficient of Kinetic Friction | ✓ | ||||
| Maximum Peeling Load | ✓ | ||||
| Maximum Peeling Resistance | ✓ | ||||
| Peeling Load | ✓ | ||||
| Peeling Resistance | ✓ | ||||
| Minimum Peeling Load | ✓ | ||||
| Minimum Peeling Resistance | ✓ | ||||
| Maximum Torque | ✓ | ||||
| Minimum Torque | ✓ | ||||
| Average Torque | ✓ | ||||
| Torque at Break | ✓ | ||||
| Clockwise Peak Register | ✓ | ||||
| Counter-Clockwise Peak Register | ✓ | ||||
| Result at Maximum | ✓ | ✓ | |||
| Result at Minimum | ✓ | ✓ | ✓ | ||
| Average Result | ✓ | ✓ | ✓ |
There are 2 ways results can be added:
- Creating New Test
- By clicking Results button from Test Tool Panel.

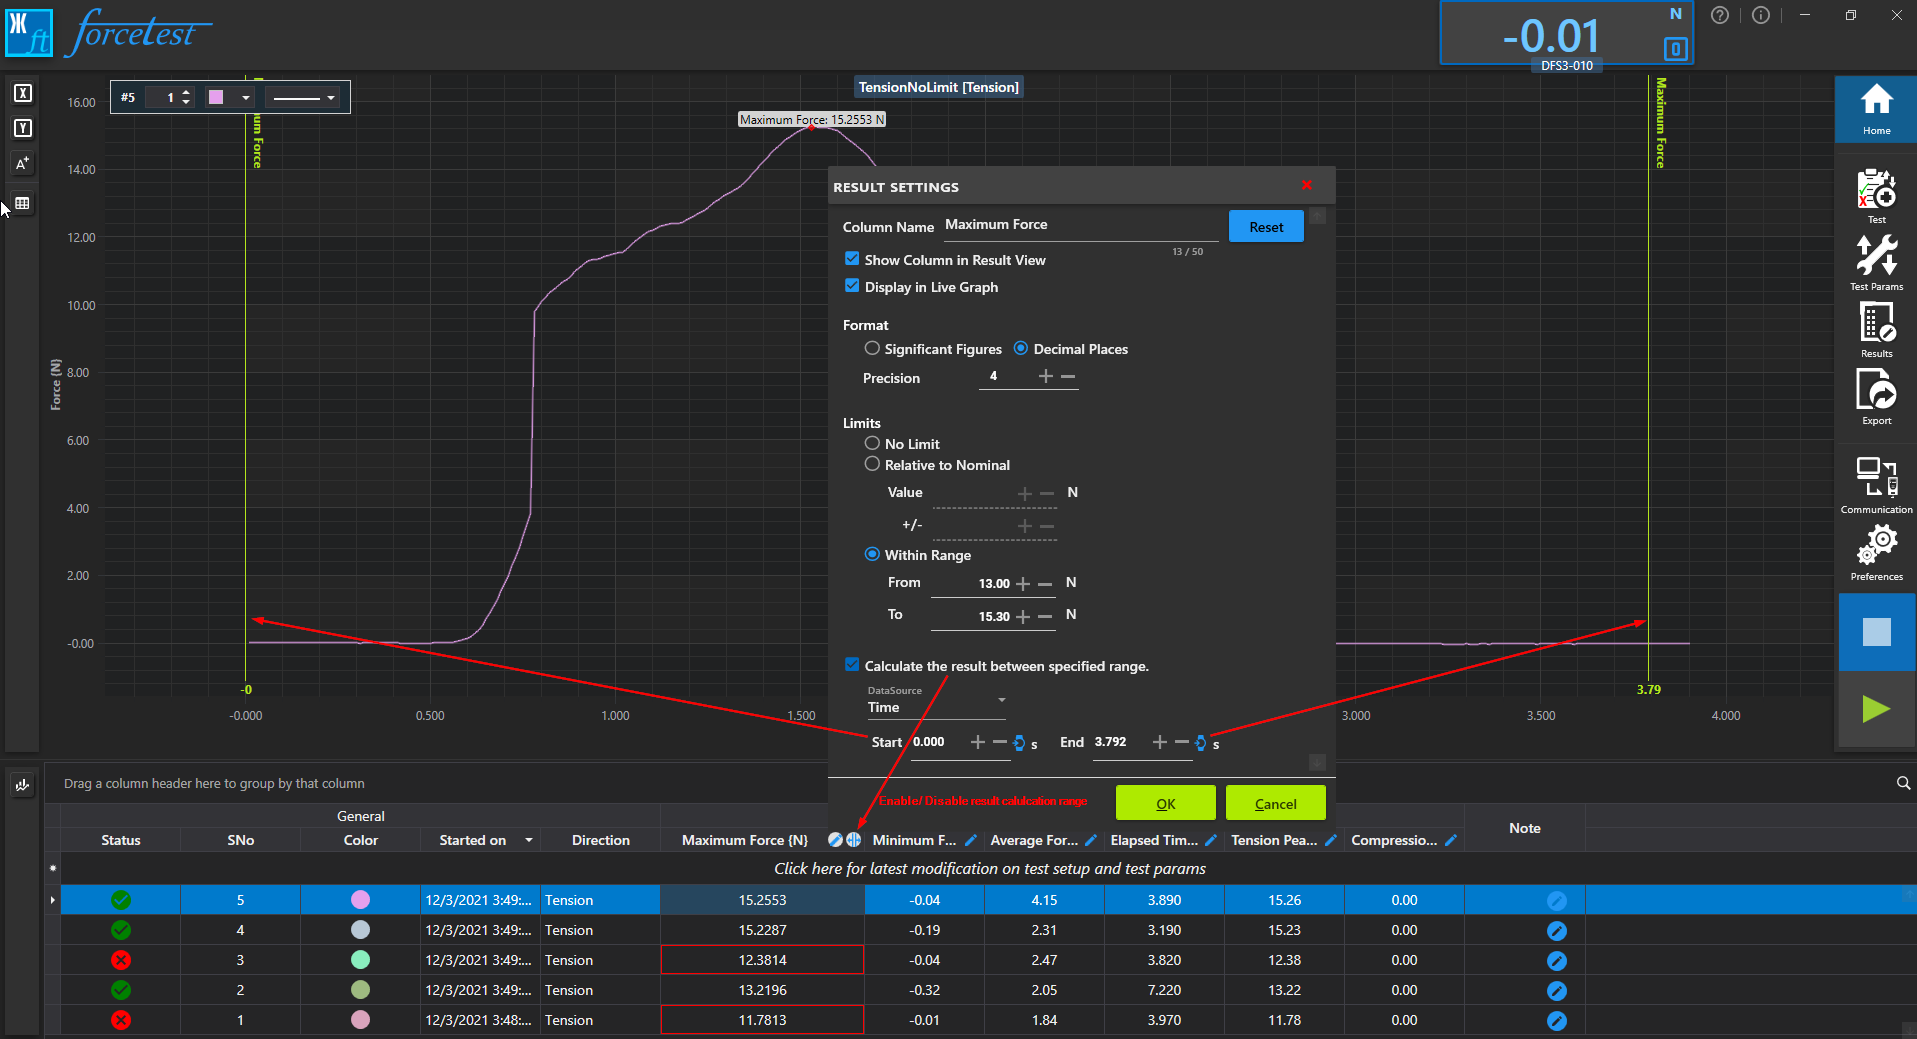
Selected Results will be displayed on Test Record View. The individual column on Test Record View allows you to edit the respective result properties. Click 🖉 icon to edit the result properties.
Column Name - Allows you to change the default result name while displaying in Test Record View.
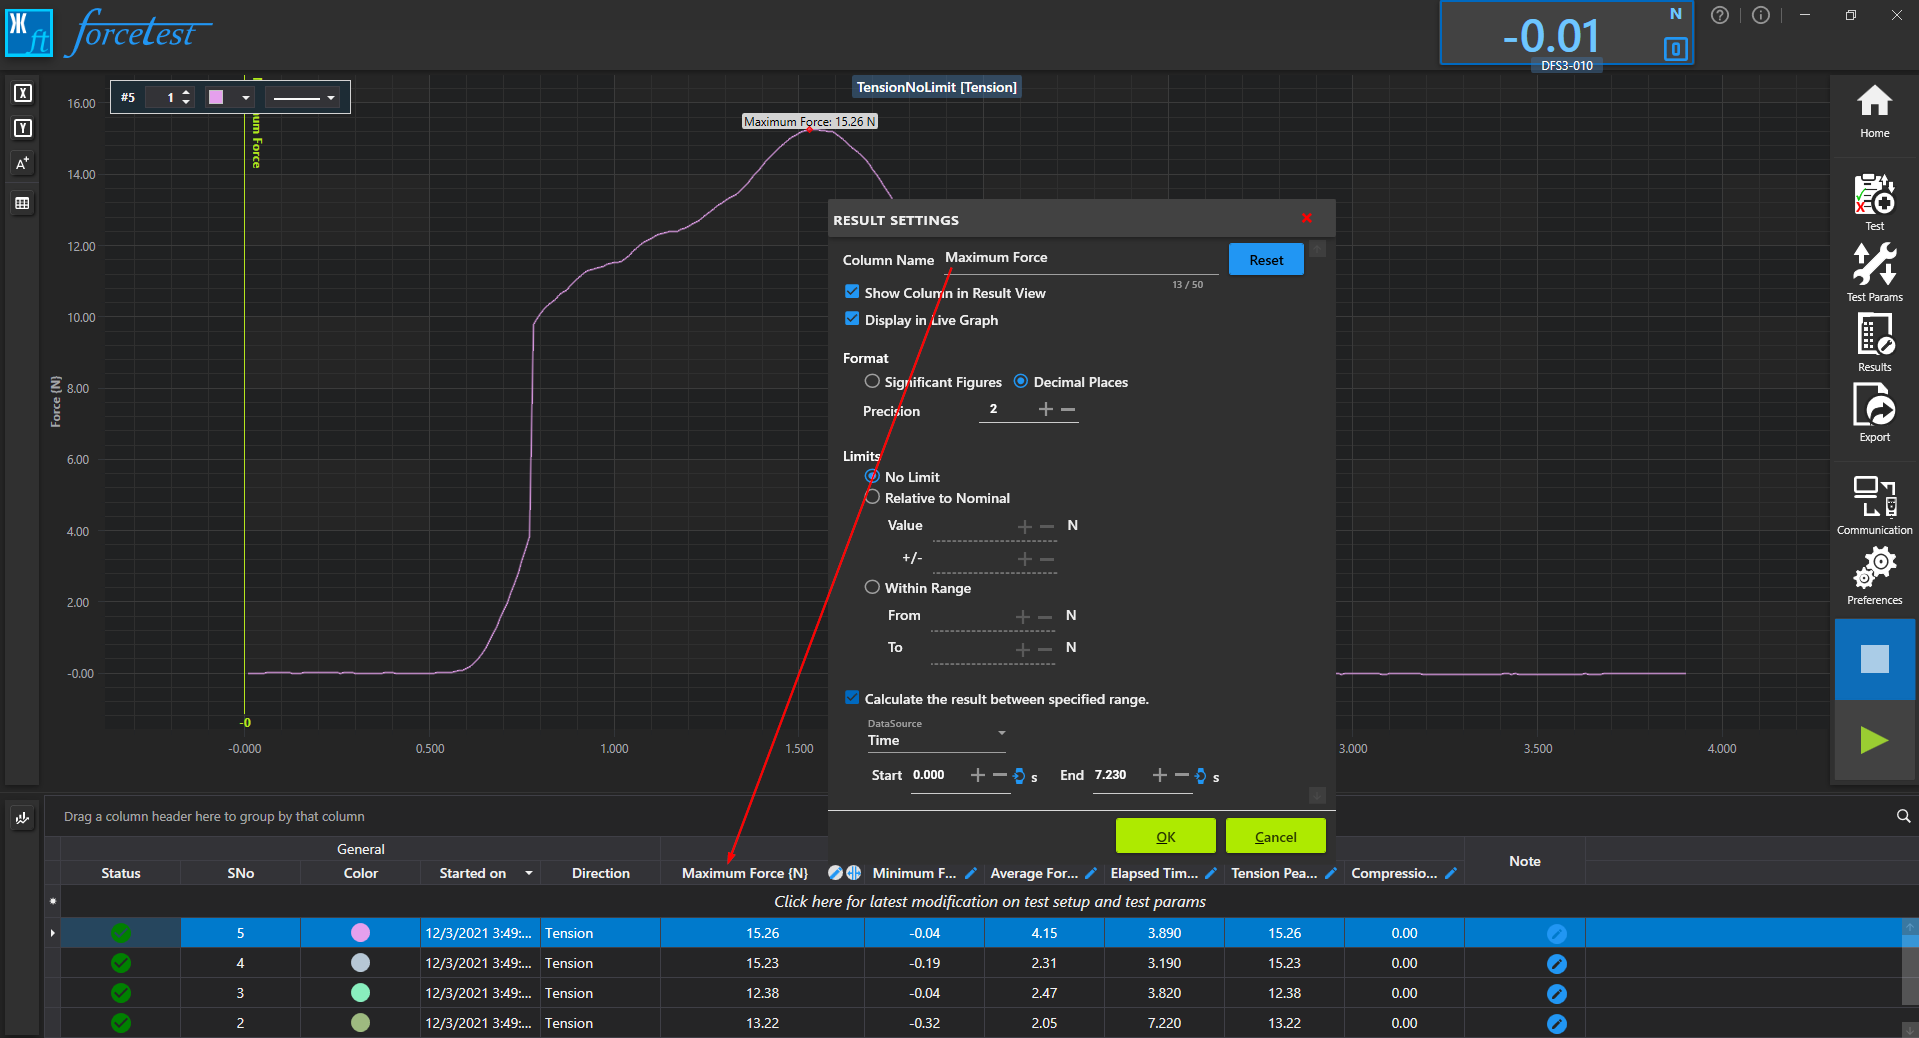
Display in Live Graph - Display the result value as a marker/annotation on Graph View.
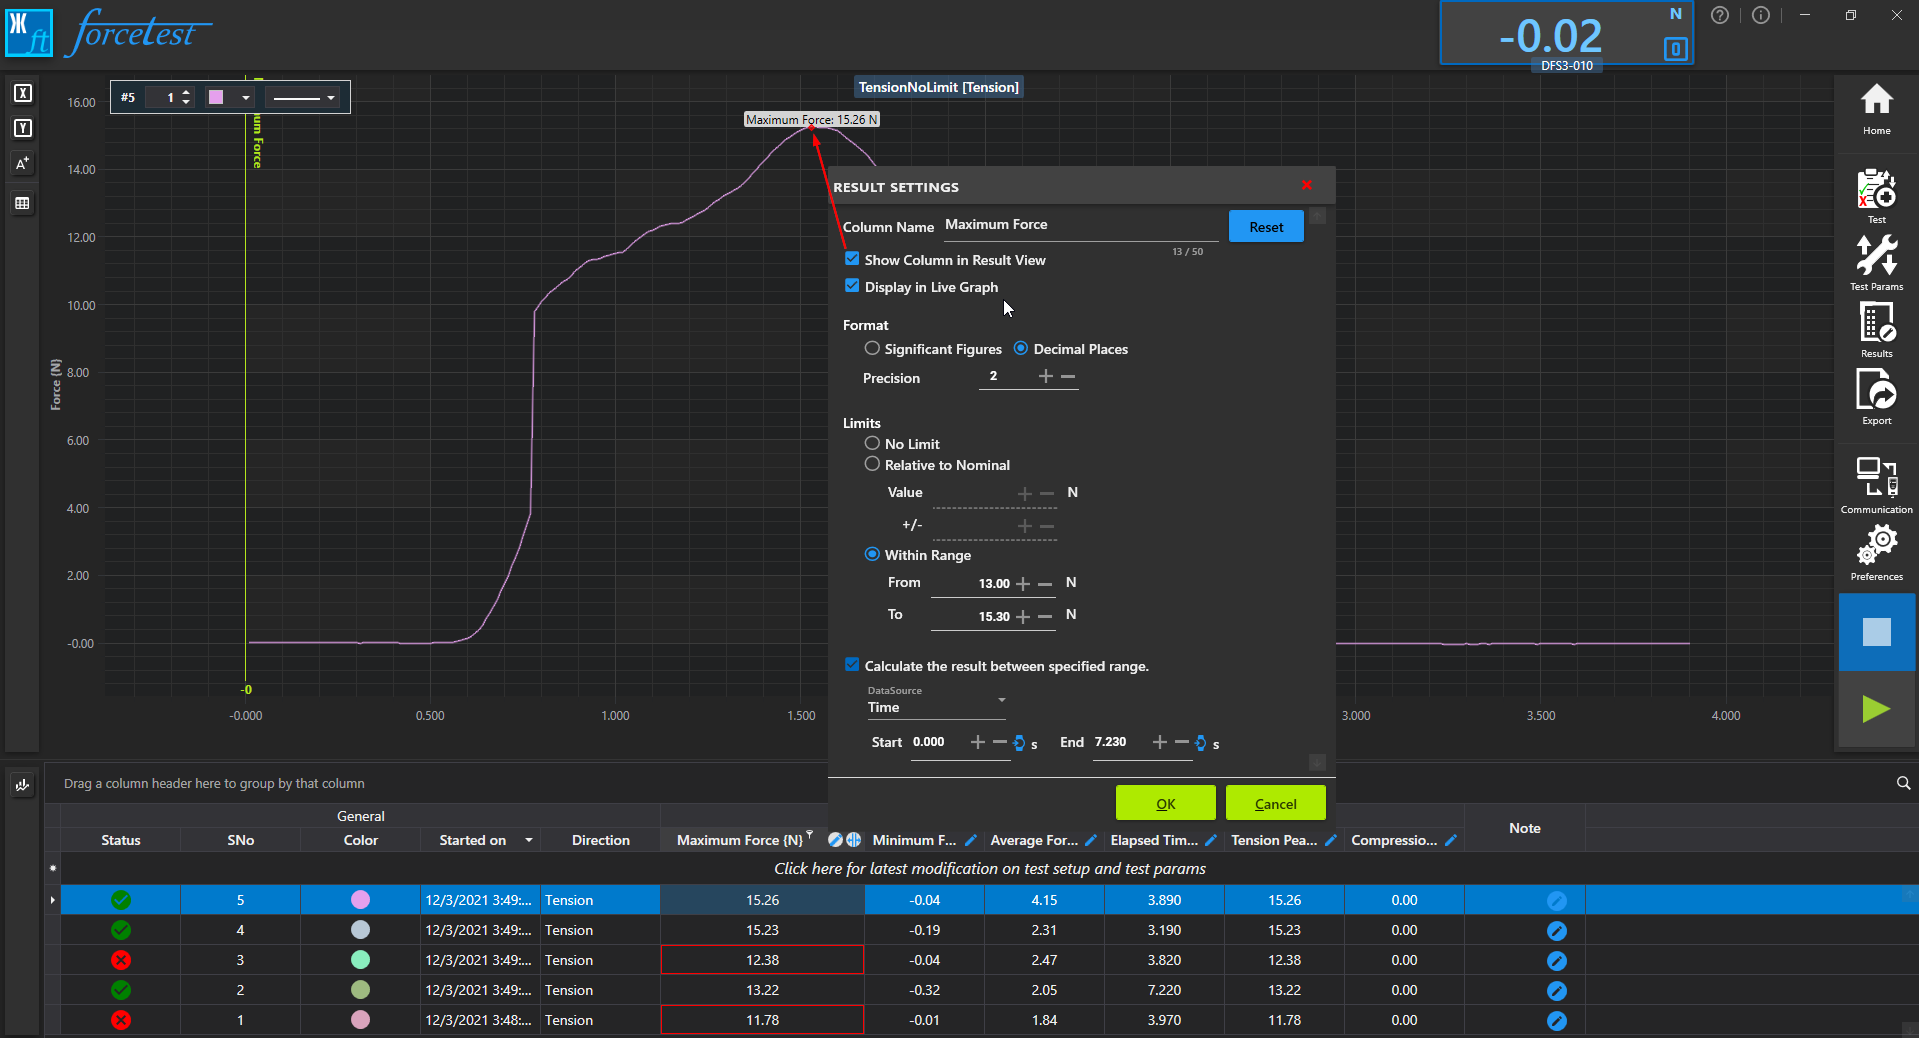
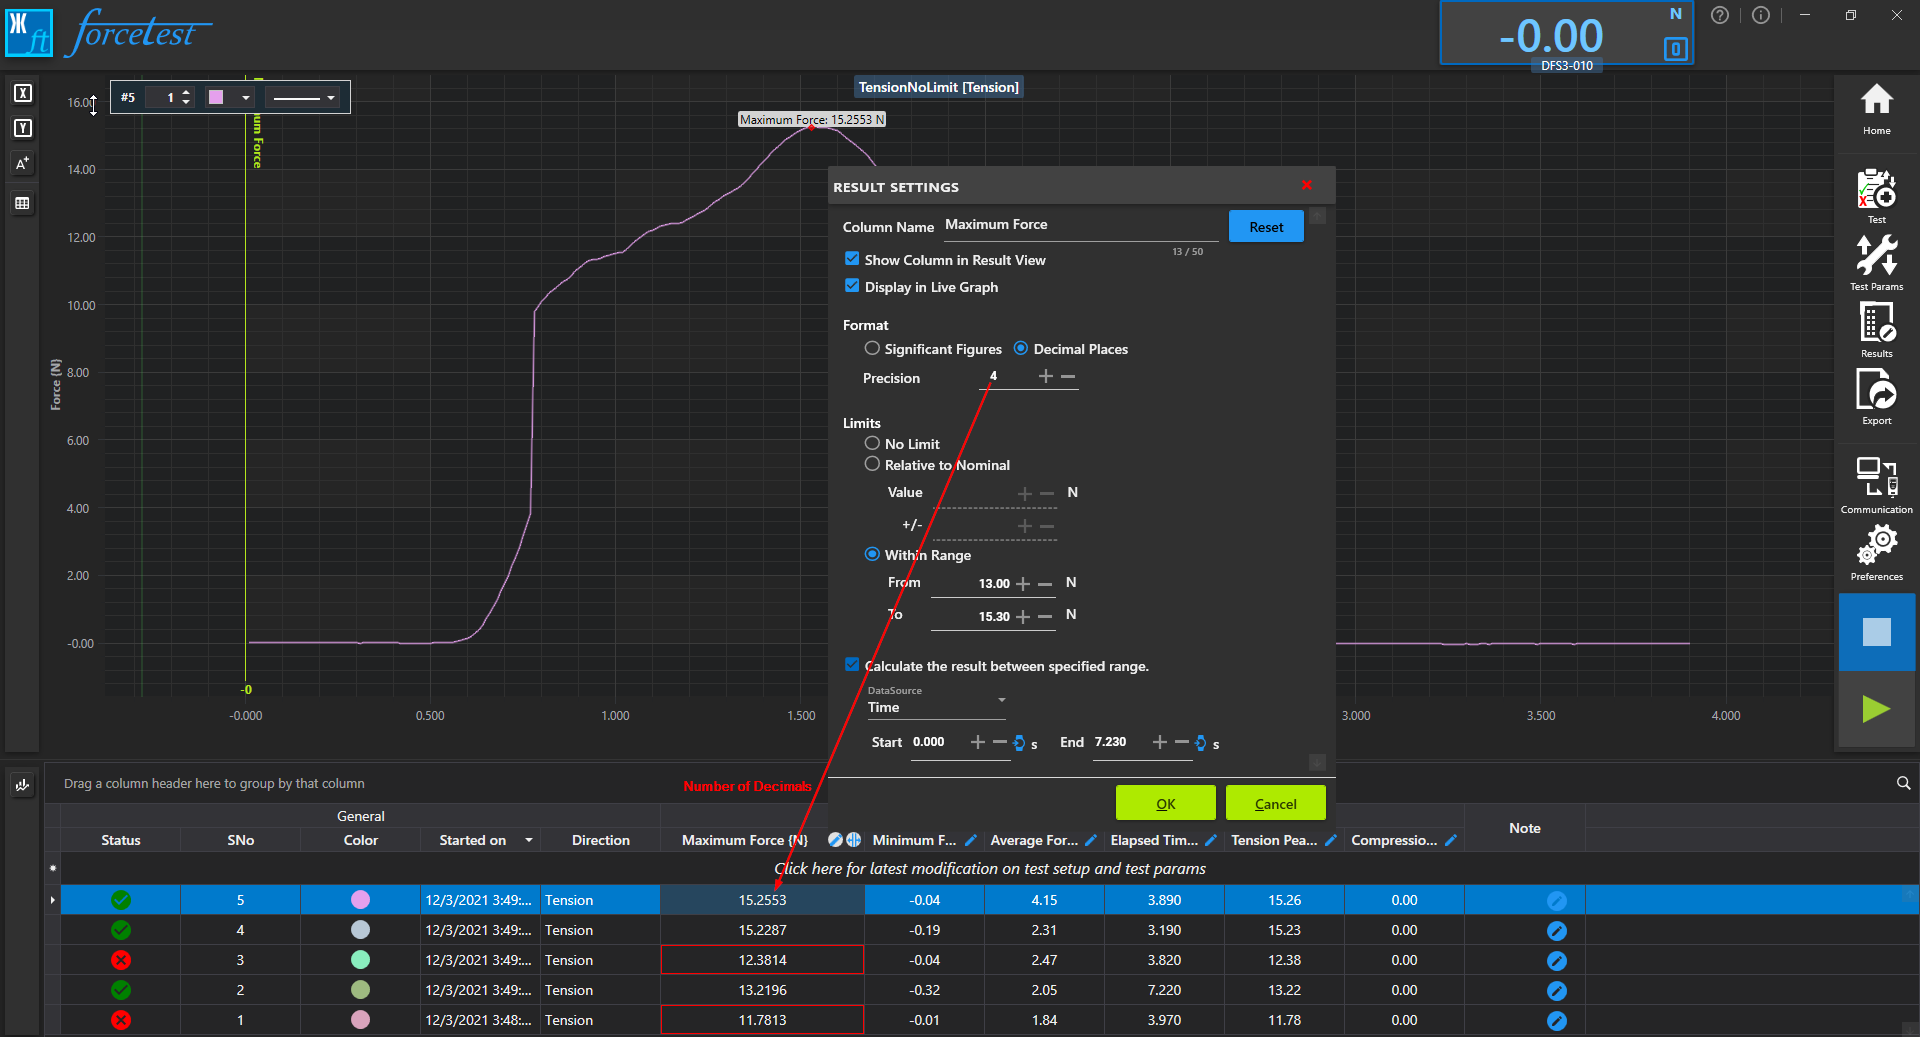
- Format - Calulcated result will be formatted depending on the selection.
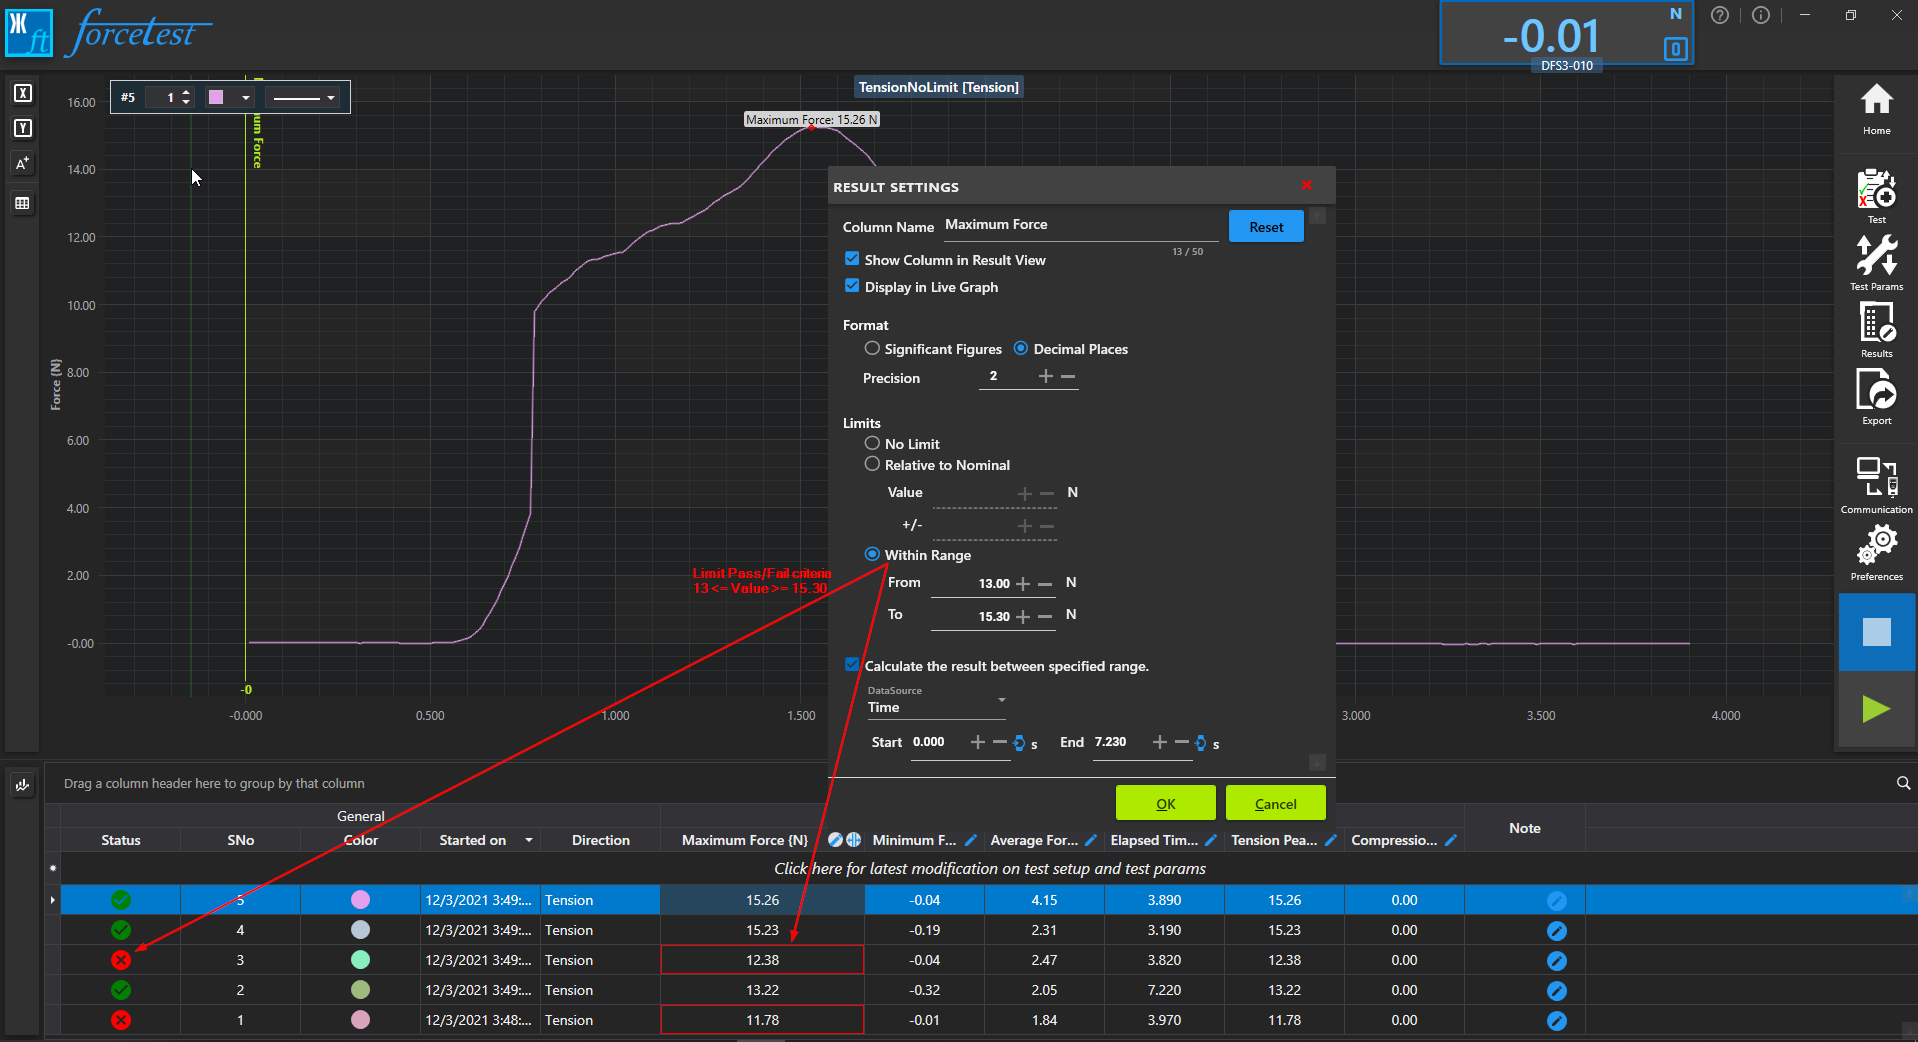
- Limit - Allows you to define the Pass/Fail criteria. This will affect the status of test.
- Calculate the result between specified Range allows you to define the range within which the result is to be calculated. Once enabled, a view finder icon appears on the respective column header along with two vertical lines on X-Axis of the Graph View. You can hide or show the vertical range bar on graph by clicking the view finder. You can drag the lines to calculate result within the selected range.
Note
Some Results may not have some of the settings mentioned above. For eg: Tension/Compression Peak Register cannot have Display on Live Graph and Calculation Range options.
See Also Statistics